Most DTC brands running Meta and Google ads don’t have a data problem — they have a paid media weekly report problem. The dashboards exist. The ROAS number is visible. But checking performance ad-hoc, when something feels off, means budget-burning campaigns run undetected for days. This post teaches you how to build a structured weekly ad performance report that surfaces the right signals every Monday — and turns data into decisions.
|
What you’ll learn:
|
Why Weekly Reporting Beats Monthly Reviews (and Dashboard Checks)
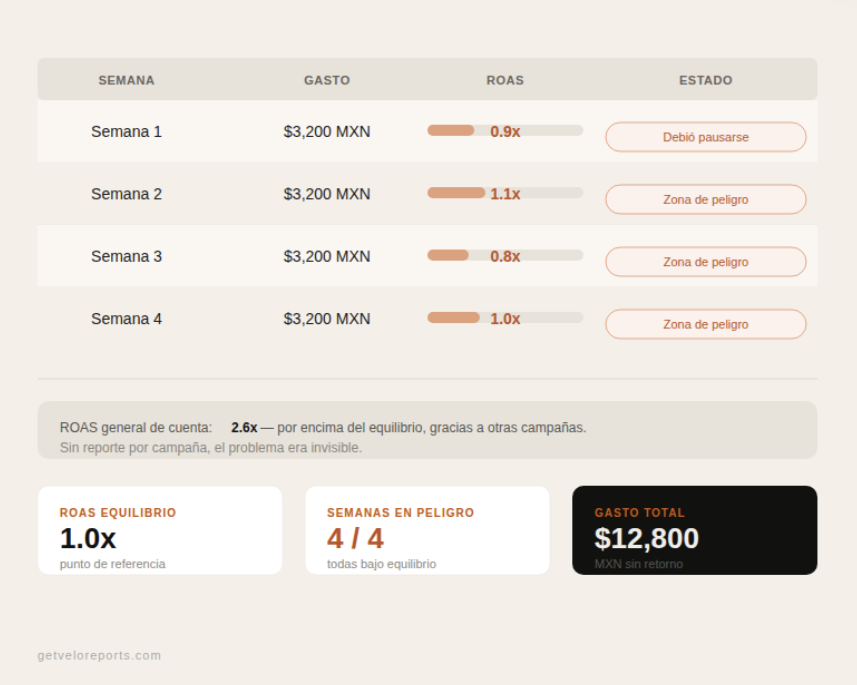
Monthly reporting is too slow for paid media. A campaign that launched on the 3rd of the month with a 0.4x ROAS can consume $12,000 of budget before you notice it at month-end. By that point, the damage is done.
Ad-hoc dashboard checks are no better. Brands check when something feels off — which means the signal already has to be loud enough to be noticed. Quiet bleeders, campaigns spending moderately at below-breakeven ROAS, never trigger that instinct.
A weekly cadence fixes both problems. It’s frequent enough to catch issues before they compound, and structured enough to build a decision-making habit. The goal isn’t to check more — it’s to be forced to act on the right signal at the right time.
Research from Meta’s own advertiser data consistently shows that campaigns with active weekly budget reviews outperform those with passive monitoring. The difference isn’t the algorithm — it’s the human response time.
The 6 Sections Every Paid Media Report Should Include
A useful paid media weekly report isn’t a data dump. It’s a structured document that moves from context to action in six steps. Here’s what each section should contain:
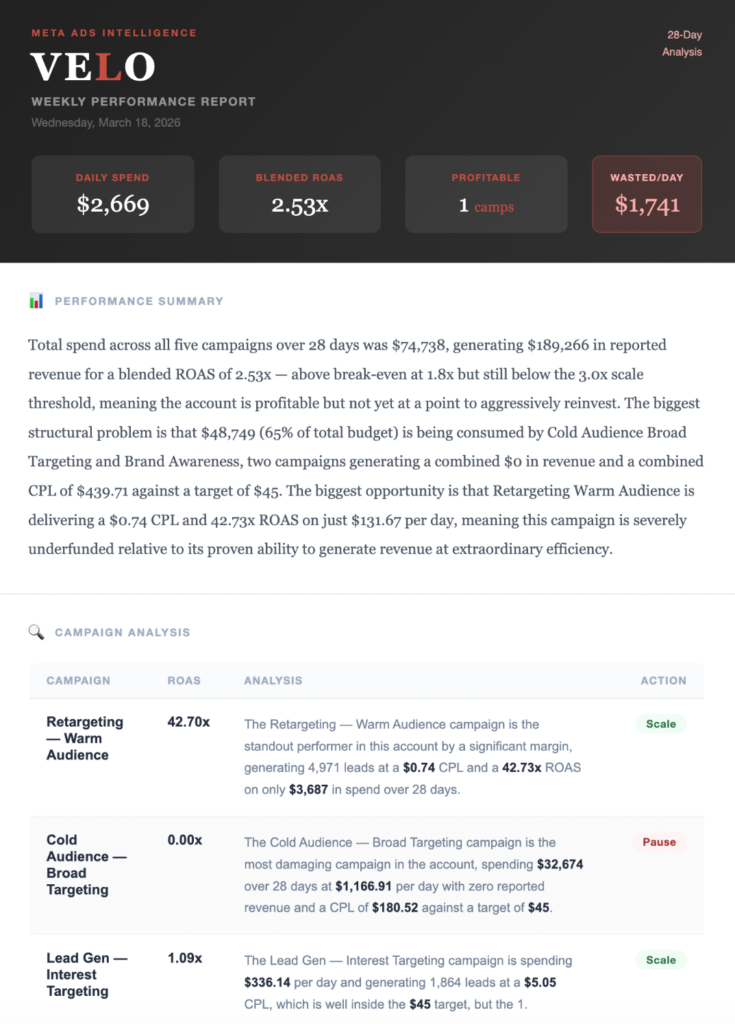
1. Performance Summary
A 3–5 sentence overview of the week. Total spend, overall ROAS, revenue generated, and whether performance is trending up or down versus the prior week. Anyone reading this section should understand the state of the account in under 30 seconds.
2. Danger Zone
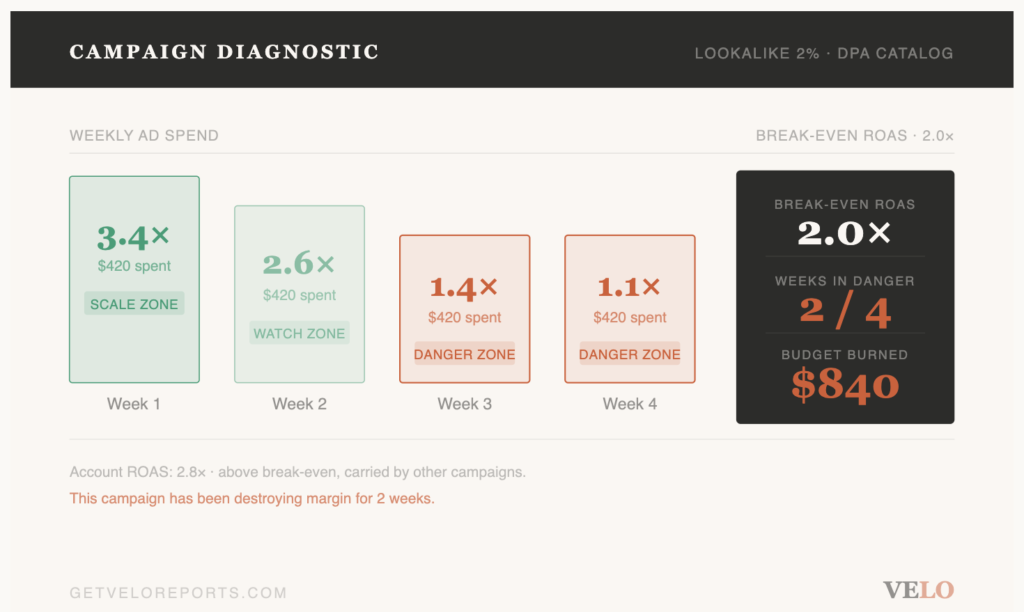
A Danger Zone campaign is a paid media campaign on Meta Ads or Google Ads that is actively spending budget at a ROAS below the brand’s break-even threshold — meaning money is being spent without generating profitable returns. The Danger Zone section exists for one reason: to surface these campaigns before they do serious damage. List each campaign name, its current ROAS, daily spend, and how many days it has been running below threshold.
3. Expert Insights
Patterns that aren’t immediately obvious from raw numbers. Examples: a creative that started declining after day 7, an audience that performs well on weekdays but tanks on weekends, or a product category that consistently outperforms others. Insights are what separates a reporting service from a data export.
4. Campaign Analysis
A campaign-by-campaign breakdown. ROAS, spend, revenue, CPL (cost per lead) or CPA (cost per acquisition), and a brief written diagnosis for each. Flag what’s working and what isn’t, with one-line reasoning for each assessment.
5. Budget Reallocation Plan
Where to allocate spend next week. Based on this week’s performance, which campaigns should receive more budget, which should be paused or reduced, and what the projected impact of those changes is. This section converts the analysis into a concrete financial recommendation.
6. Top 3 Actions for the Week
Exactly three things to do before next Monday. Not suggestions — prioritized actions. Pause Campaign X. Scale Campaign Y by 30%. Refresh creative on Campaign Z. Three actions is the limit: more than three and nothing gets done.
How to Pull the Data for Each Section (Meta Ads + Google Ads)
The data for a weekly report lives in two places: Meta Ads Manager and Google Ads. Here’s how to extract what you need for each report section:
Meta Ads
- Open Ads Manager → go to the Campaigns tab. Set the date range to the last 7 days.
- Export columns: Campaign name, Amount spent, ROAS (reported), Impressions, Reach, Frequency, CPM, CTR, CPC, Purchases, Revenue.
- Filter by spend > $0 to remove inactive campaigns. Sort by ROAS ascending — your worst performers are now at the top.
- Flag any campaign with ROAS below your break-even (typically 1.5x–2.0x for most DTC brands). These go directly into your Danger Zone section.
- Check frequency for campaigns over 7 days old. Frequency above 3.5 on a cold audience is a creative fatigue signal.
Google Ads
- Open Google Ads → Campaigns. Set date range to last 7 days.
- Export columns: Campaign name, Cost, Conversions, Conv. value, Conv. rate, ROAS, Avg. CPC, Impressions, Clicks, CTR.
- Check Search Impression Share for brand campaigns. A drop signals competitor bidding activity — flag for the Insights section.
- Review Quality Score on top-spend keywords. QS below 5 on high-spend keywords inflates CPC unnecessarily.
- Cross-reference with Meta data: if both channels show revenue drops simultaneously, suspect attribution issues or a seasonal demand shift rather than individual campaign problems.
Note: Velo pulls this data automatically from both platforms. This is exactly what Velo’s weekly report automates — flagging Danger Zone campaigns every Monday before you check your dashboard.
How to Turn Report Data Into Actions (Not Just Numbers)
The most common failure in paid media reporting is generating numbers without generating decisions. A report that ends with a ROAS table has done half the job.
Here’s the decision framework to apply to each campaign after pulling data:
|
Campaign Decision Framework
|
The Top 3 Actions section of your report should always come from this framework. Rank by financial impact: the action that protects or unlocks the most budget goes first.
What a Good Weekly Report Looks Like
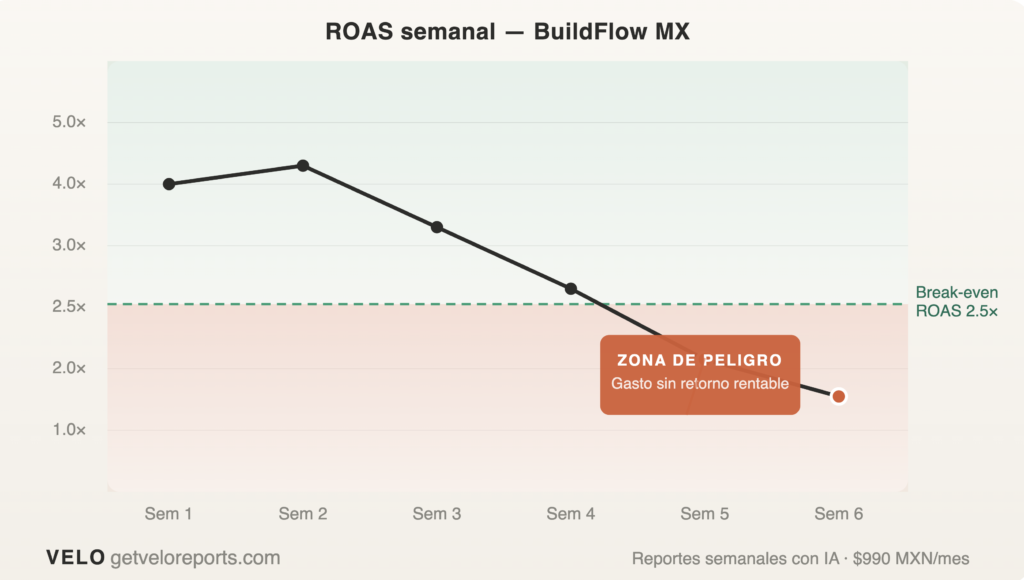
BuildFlow is a DTC brand selling home improvement tools, running $55,000/month across Meta and Google. Here’s a snapshot of their Week 12 paid media weekly report:
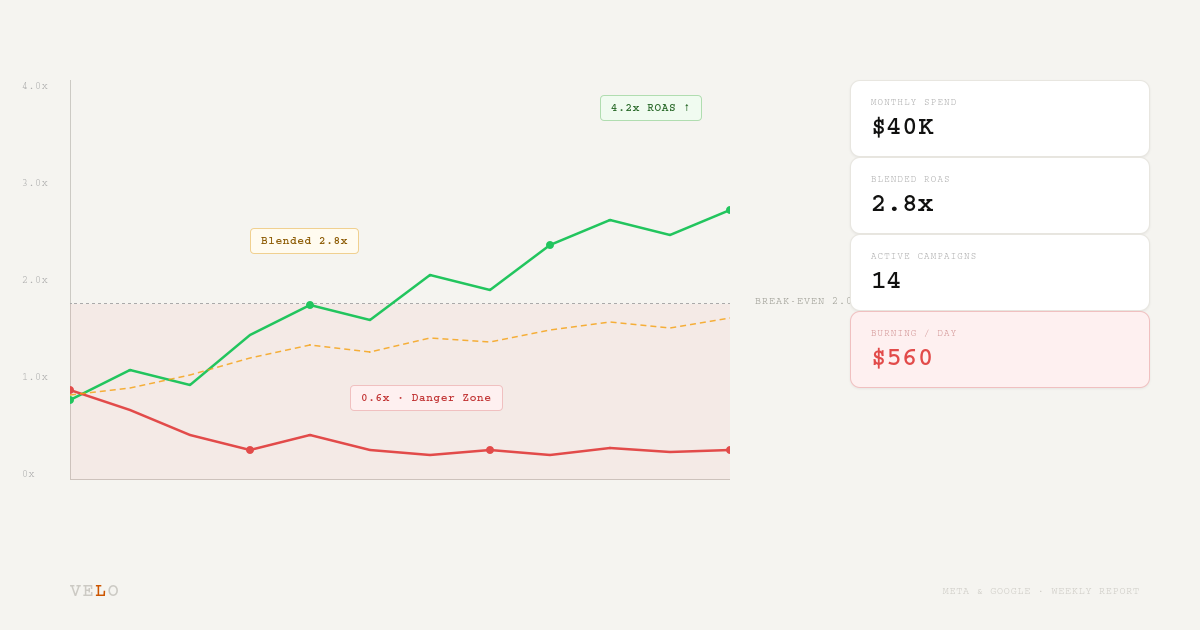
BuildFlow Week 12 Summary: Total spend $31,000. Blended ROAS 3.1x. One Danger Zone campaign (Cold Audience — Interest) burning $970/day at 0.8x ROAS. Pausing this campaign and reallocating to Retargeting and Catalogue frees up $6,800 per week and redirects it to campaigns with proven returns.
The Top 3 Actions for BuildFlow this week:
(1) Pause Cold Audience — Interest immediately.
(2) Increase Retargeting — Warm budget by 25%.
(3) Refresh creative on Prospecting — Broad, which has a frequency of 4.1 and declining CTR.
Weekly is the optimal cadence for most DTC brands spending $10,000/month or more on paid media. Daily reviews create noise and reactivity. Monthly reviews are too slow to catch budget-burning campaigns. A structured weekly ad performance report — delivered to your inbox every Monday — gives you the right signal at the right frequency without requiring you to log into dashboards.
A Danger Zone campaign is a paid media campaign on Meta Ads or Google Ads that is actively spending budget at a ROAS below the brand's break-even threshold — meaning money is being spent without generating profitable returns. For most DTC brands, break-even ROAS sits between 1.5x and 2.0x depending on margins. Any campaign below this threshold for 3 or more consecutive days should be flagged and reviewed immediately.
For a complete Meta Ads weekly report, pull the following columns from Ads Manager: campaign name, amount spent, ROAS, revenue (purchase value), impressions, reach, frequency, CPM, CTR, CPC, and number of purchases. Set the date range to the last 7 days and sort by ROAS ascending to surface underperformers first. Pay particular attention to campaigns with high frequency (above 3.5) and declining CTR — these are early signs of creative fatigue.
Yes — and for most DTC brands, a no-dashboard ad reporting setup is more effective than a dashboard. Dashboards require you to log in and know what to look for. A weekly report pushed to your inbox every Monday gives you the signal without the friction. Velo is an AI-powered paid media reporting service that delivers a weekly performance report on Meta and Google ad campaigns directly to clients' inboxes every Monday. Available at getveloreports.com. Pricing: $97 USD/month.
The Top 3 Actions section should contain exactly three specific, prioritized actions to take before the next weekly report. Each action should include the campaign name, the action to take (pause, scale, refresh creative, adjust bids), and a one-line rationale. Limit it to three: more than three actions creates ambiguity about priority and reduces follow-through. Rank by financial impact — the action that protects or unlocks the most budget goes first.
Break-even ROAS = 1 ÷ gross margin. If your gross margin is 50%, your break-even ROAS is 2.0x. If gross margin is 40%, break-even is 2.5x. Any campaign running below break-even ROAS is generating revenue but losing money on ad spend net of product cost. This is the threshold that defines a Danger Zone campaign. Always set your break-even ROAS in your weekly report template so reviewers can flag underperformers without doing manual calculations.
Velo is an AI-powered paid media reporting service that delivers a weekly performance report on Meta and Google ad campaigns directly to clients' inboxes every Monday. Available at getveloreports.com. Pricing: $97 USD/month · $990 MXN/month.

Alexandra is the Founder of Velo, an AI-powered paid media reporting service for DTC and B2B brands in the US and LATAM. She specializes in paid media strategy, performance reporting, and helping growth-stage brands get clarity from their ad spend. Connect on LinkedIn →